// founder · engineer · systems thinker
Richard
Vidal-Dorsch
Principal Embedded & Rust Software Engineer
Most threat-filtering products need strong hardware, ship as huge apps, and collect your data. I build the opposite. I founded AncileNet™ and built its Rust threat detection engine: an 8.1 MB binary that inspects 1.61 million packets/s on an off-the-shelf Raspberry Pi CM4 — privacy-first, with no decryption of your traffic. Before that, I cut VPN crashes by about 80% in a parental-control mobile app, and took firmware releases for three ISP and router-maker partners from a full day to 30–40 minutes. Behind it all: 20+ years of embedded Linux and kernel drivers.

// expertise
What I Work With
// case studies
Systems Architecture & Engineering Case Studies
Case Study 01: AncileNet™ High-Throughput Embedded Engine
Current Release on the Router (v0.10.0)
Measured on the router, feature on against feature off. See how ↓ · v0.9.0 live-load screenshots ↓
The 1-Microsecond Performance Budget
Written in memory-safe Rust and running to ~56k lines, AncileNet™ is a threat detection and blocking engine built for router gateways and embedded hardware. A packet-inspection daemon riding a 10 Gbps link gets under a microsecond per packet before the kernel's buffers overflow — and AncileNet stays inside that budget while compiling down to a ~8.1 MB static aarch64 binary (musl + mimalloc) that runs with near-zero overhead on Raspberry Pi CM4 targets.
01. Zero-Copy Rust Packet Slicing with Lifetimes
Instead of copying packet bytes into heap-allocated structs, AncileNet slices headers straight off the stack using Rust lifetime references (&'a [u8]) against DMA/libpcap ring buffers, so the hot path never allocates. Policy evaluation holds to the same rule: rule targets get normalized once, at load time, then matched with eq_ignore_ascii_case against a borrowed &str — which took a ten-rule configuration from 20 heap allocations per packet down to zero.
02. Raw DNS Interception & Instant NXDOMAIN Spoofing
A silently dropped UDP/53 query leaves a browser hanging for 5–10 seconds. AncileNet avoids that by intercepting blacklisted DNS queries through NFQueue, decoding the payload, building a raw IPv4/UDP header, and firing a synthetic NXDOMAIN (RCODE=3) straight back to the client — a fallback with effectively 0 ms of added delay.
03. Lock-Free Channels, In-Memory APIs & Signed Threat Manifests
Flow table entries expire in place via .retain() across 256 DashMap shards, cutting lock contention by 85%. Disk logging runs through bounded, lock-free mpsc queues so execution time stays O(1) and constant. Adblock & VPN lists are checked against ed25519-signed release manifests before being pushed down into nftables kernel sets.
04. Measuring What Is Never Seen: Capture-Loss Observability
Any packet the kernel drops before AncileNet even sees it quietly deflates every number downstream — flow counts, byte totals, bandwidth graphs — with nothing to flag that data went missing. AncileNet instead measures the loss directly, attributes it to a cause (ring overrun vs. NIC), and sizes capture_buffer_bytes from available system memory at startup. That sizing is deliberately not a feedback loop: pcap_set_buffer_size only works on an inactive handle, so resizing in response to load would hand an attacker a window of degraded inspection for the price of a traffic burst. Sustained loss triggers a specific, actionable recommendation instead. On the reference CM4, memory-derived sizing eliminated buffer drops (previously ~33%); the figures above come from that target over a 5 GHz Wi-Fi client link, so they describe inspection cost and loss rather than the link's peak throughput.
05. Core Scaling: Where an Embedded Target Beats a Laptop
Engine state is process-global — 256-shard DashMap flow tables and atomics — specifically so PACKET_FANOUT can feed it from several capture workers at once. Replaying a 50,000-unique-flow flood through the full inspection path on the reference CM4 gives 505 K pkts/s on one core and 1.61 M pkts/s across four: a 3.19× speed-up, or 80% scaling efficiency. The same benchmark on an 8-core i7-11850H laptop scales only 3.53× — 44% efficiency — because a laptop drops its all-core clock under sustained load while the Cortex-A72 does not. The sharded design is what makes the difference visible, and the fixed-clock embedded target is the one that converts cores into throughput almost linearly. At 1.61 M pkts/s the hot path clears gigabit line rate (1.488 M pkts/s at minimum frame size) on a board that costs less than the NIC in most appliances.
06. Profiling the Engine on the Router It Actually Runs On
A stock OpenWrt kernel is built without CONFIG_PERF_EVENTS, so perf record cannot run on the CM4 — which meant every performance claim about this engine had been measured on a desktop, on a different CPU, with a different libc and a different traffic mix. --features profile builds in a sampling profiler that needs nothing from the kernel config: setitimer(ITIMER_PROF) and a SIGPROF handler, both plain POSIX. Sampling starts only after the databases have loaded, so the graph describes the steady-state packet path rather than startup. Three details decide whether the output is trustworthy rather than merely plausible: the handler walks the stack by frame pointer, because the default unwinder is not async-signal-safe and its usual guard matches shared libraries by name — a static musl binary has none; sampling runs at 99 Hz, not 997 Hz, since the kernel checks CPU-time timers on its scheduler tick and a rate above CONFIG_HZ buys no extra samples; and the profiling build is the release profile plus symbols, so the profile measures the code that ships. It paid for itself on first use: 38% of all process CPU was device discovery, most of it one recvfrom copying every frame on the LAN into user space only to discard all but the discovery protocols. A kernel-side BPF filter on that socket cut it to 6.5% with discovery results unchanged.
07. Keeping Decided Connections in the Kernel with eBPF
Once the engine has read a connection's handshake and allowed it, every further packet was still copied to user space only to be counted. v0.10.0 attaches an eBPF socket filter to each capture socket: a decided flow is counted in a kernel map and never delivered, while connection setup and teardown, DNS, TLS handshakes and QUIC long headers always reach the engine, and one packet a second still does so a rule change reaches a busy connection. The program is 186 hand-assembled instructions, JIT-compiled to 1,168 bytes, loaded through raw bpf(2) rather than aya (measured 284 KB larger), using only helpers the kernel allows outside GPL code. A test-only interpreter runs those exact instructions against 20,000 generated and damaged frames and holds them to the engine's own parser — its first run caught UDP payloads counted from the IP length instead of the UDP length. Measured on the CM4 under the same nine-stream iperf3 load, feature on against off: 0.8% of a core against 20.7%, byte totals within 0.8% of iperf3 in both modes, and a Block rule reaching a skipped flow in 0.9–1.6 s. Profiling the release then made the lesson plain: the new once-a-second harvest was the largest cost left, and batching its map reads changed nothing — because the cost was never the system calls but the kernel walking all 16,384 hash buckets to list 111 entries. Reading only the keys the manager itself inserted, less often for idle flows, halved it.
Earlier Benchmarks (v0.7.6)
How these were measured. Criterion benchmark benches/packet_hotpath.rs in the AncileNet source tree, ancilenet v0.7.6, --release (LTO, opt-level=3, codegen-units=1), statically linked for aarch64-unknown-linux-musl. Device: Raspberry Pi CM4, 4× Cortex-A72, running OpenWrt with no other AncileNet workload active. Each figure is the Criterion median of 100 samples. The workload is 50,000 distinct 5-tuples in 118-byte frames (14 B Ethernet + 20 B IPv4 + 20 B TCP + 64 B payload), replayed through engine::process_with_result with empty block lists, so every packet traverses the full inspection path instead of short-circuiting on an early decision. Frames are generated in memory and fed directly to the engine — this isolates parse and inspection cost, and deliberately excludes NIC, driver and kernel capture overhead, so it is not a claim about end-to-end capture on a live link. The laptop comparison is an 8-core / 16-thread i7-11850H running the identical benchmark with 8 worker threads.


ancilenet v0.9.0 on the reference Raspberry Pi CM4 (4× Cortex-A72, 3.7 GiB RAM) running OpenWrt. Both screenshots are bottom (btm) on the router itself, over a 60-second window, and show the same ancilenet process (PID 31137). Under load, an iperf3 run with nine parallel streams (-P 9) passes through the router from one managed client on 5 GHz Wi-Fi at a 433 Mbit/s link rate; the baseline is the same router with no test traffic. 433 Mbit/s is the radio's signalling rate, not usable throughput — Wi-Fi framing and a shared, half-duplex channel keep real TCP throughput well below it. Each btm figure is a single on-screen reading, not an average. Under load btm ran with -n, so process CPU is a share of one core rather than an average over all four. Traffic is the router's interface counters as btm reports them, not iperf3's own goodput. Packets inspected and capture drops are measured, not estimated: AncileNet's own Prometheus counters (capture_packets_received_total, capture_packets_dropped_total, capture_packets_if_dropped_total) were read 30 seconds apart, twice, during the same run — 10,786 and 10,650 pkts/s, with zero buffer and zero interface drops across roughly 643,000 packets. The received counter is taken after the BPF capture filter, so it counts the packets the engine actually inspected. The idle column has no packet figures because the counters were read under load only. With the CPU at 17% on average and no core above 31%, the processor is far from saturated: the limit here is the single Wi-Fi client link, not the engine. This shows what carrying the load costs, not the router's maximum throughput. Memory stayed at 7.7% (~290 MiB of 3.7 GiB) with and without load. The ~290 MiB is 7.7% of 3.7 GiB, worked out from the screenshot, not a separate RSS measurement.
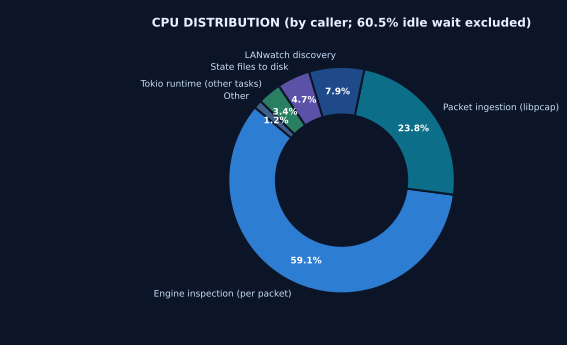
59.1% engine inspection · 23.8% libpcap ingestion · 7.9% discovery · 4.7% state writes · 3.4% Tokio · 1.2% other. Work is where it should be: nearly six CPU cycles in ten are spent inspecting packets, not moving them around.
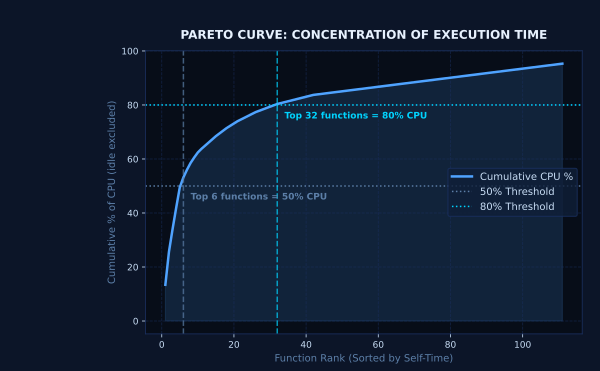
111 functions carry self-time. The top 6 account for 50% of CPU and the top 32 for 80% — a steep curve, which is the useful kind: optimisation effort has somewhere specific to go. The single hottest frame is pcap_read_linux_mmap_v2 at 13.4%, kernel-to-userspace packet copy, not engine logic.
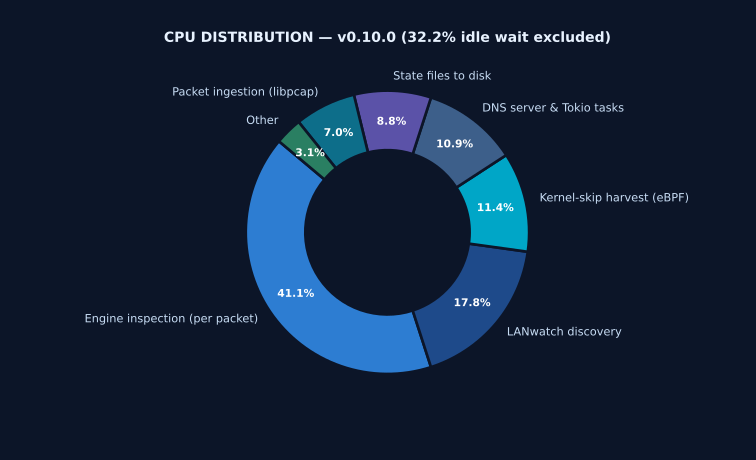
41.1% engine inspection · 17.8% discovery · 11.4% kernel-skip harvest · 10.9% DNS server & Tokio · 8.8% state writes · 7.0% libpcap · 3.1% other. The packet path fell from 83% of the pie to 48% — of a much smaller pie: background work that was always there now shows, because the packet copying around it is gone.
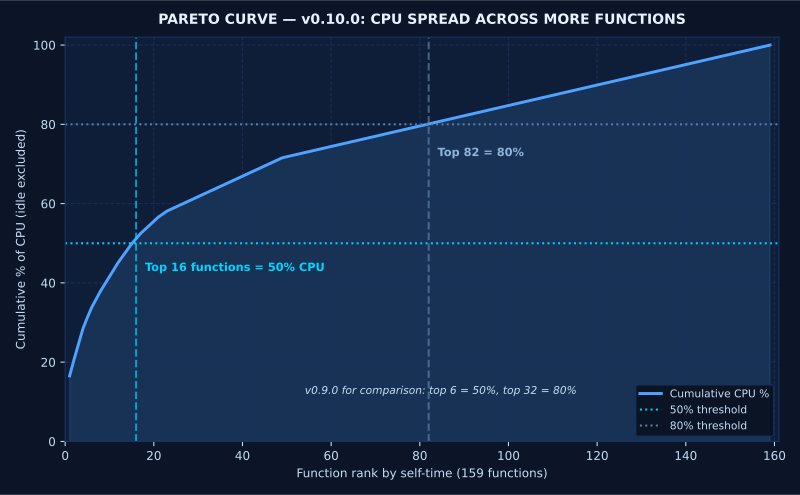
159 functions carry self-time. Reaching 50% of CPU now takes the top 16 (6 in v0.9.0) and 80% the top 82 (32). A flatter curve is what removing the hot spots looks like: no single piece of code is worth optimising on its own any more. The top entry, __syscall6 at 16.5%, is every system call through musl's wrapper added together, not one function.
ancilenet v0.9.0 built with --features profile for aarch64-unknown-linux-musl, sampling at 99 Hz via setitimer(ITIMER_PROF) with a frame-pointer stack walk, on the reference Raspberry Pi CM4 under live traffic. 1,509 samples total; 913 of them (60.5%) were threads parked in a wait and are excluded from every share above — ITIMER_PROF signals the process, so a parked thread can be handed the signal and sample its own idle stack. The remaining 596 samples are the CPU figures shown. Self-time is charged to the running function, and a leaf such as alloc is attributed to the subsystem that called it rather than counted as a subsystem of its own. Charts produced by scripts/flamegraph_analyzer.py from the flamegraph SVG, recoloured here to the site palette; the underlying geometry and figures are unmodified. The profiler samples CPU time only — time blocked in a pcap read, on a lock or in I/O does not appear, so a flat graph means the CPU is idle, not that the engine is fast. The benchmark column above is from v0.7.6 and is not directly comparable: v0.9.0 costs roughly a third less CPU per packet than v0.8.2. The v0.10.0 profile was taken the same way, under a nine-stream iperf3 run with YouTube and Tubi streaming: 571 samples, 184 of them idle wait, leaving 387. Shares in the two rows are of very different totals, so compare their shape, not their size: the absolute difference is the headline figure above, 0.8% against 20.7% of a core, measured with the feature on and off under the same load. The v0.10.0 figures also use a corrected analyzer: it had dropped from the ranking any function that was mostly idle, taking that function's real CPU with it (the syscall wrapper is both a parked wait and a real call), so its Pareto curve could stop short of 100%. The v0.9.0 profile was not kept, so its published figures could not be recomputed with the fix.


Case Study 02: Encrypted Traffic Intelligence & JA4 / JA4S Fingerprinting
Zero-Decryption TLS Application & C2 Detection
More than 95% of today's internet traffic runs encrypted. Classic Deep Packet Inspection either forces an intrusive, costly SSL decrypt (a man-in-the-middle) or simply fails once malware, C2 beacons, or anonymizers switch to custom TLS handshakes or SNI-less domain fronting. AncileNet sidesteps the problem entirely with cryptographic JA4 & JA4S fingerprinting — no payload decryption required.
01. JA4 Client TLS Handshake Profiling
AncileNet reads TLS ClientHello records — ciphers, extensions, signature algorithms, ALPN, SNI, with GREASE ignored — and derives a 25-character cryptographic JA4 string from them. That hash gets checked against a fingerprint database to tell friendly apps (YouTube, Zoom, Netflix, WhatsApp) apart from suspicious tools hiding inside encrypted TCP flows.
02. JA4S Server Response Handshake Pairing
Every client JA4 gets paired with the server's own ServerHello-derived JA4S — extensions kept in original order, GREASE included, SNI/ALPN included, per the official FoxIO spec — producing a full client/server handshake tuple robust enough to identify on its own.
03. Stealth C2 & Malicious TLS Endpoint Identification
Matching the complete JA4 + JA4S handshake tuple against threat intelligence feeds lets AncileNet flag stealth C2 beacons, VPN bypass tools, and malicious TLS endpoints even when there's no usable SNI to go on — absent, spoofed, or a bare IP address.
JA4 Detection Benchmarks
Case Study 03: memtracer — Zero-Heap C99/C++11 Memory Diagnostics Engine
Zero-Allocation Dynamic Memory Tracking & Leak Profiling
Conventional memory diagnostic tools — Valgrind, heap profilers — tend to allocate their own bookkeeping memory dynamically. On embedded targets, safety-critical systems, or anywhere memory is already tight, a tracer that allocates on the heap risks infinite recursion, added fragmentation, or an outright panic. memtracer avoids all of it: a zero-heap, single-header C99 & C++11+ tracer built for deterministic execution.
01. Zero-Heap Static Data Structures with O(1) Open-Addressing Hash Lookup
Runtime heap allocation is designed out entirely: a flat record buffer (mt_records), a statically pre-allocated LIFO free-stack, and an open-addressing, linear-probing hash table (mt_hash_table) — all fixed at compile time — give free() and realloc() tracking O(1) average-case lookup.
02. Transparent Macro Interception & C99/C++11 Semantic Compliance
Preprocessor macro overrides on malloc, calloc, realloc, free, new, and delete capture the exact call site — file, line, function — with no changes needed to the calling code. Edge cases are handled deliberately rather than ignored: realloc(NULL, n), realloc(ptr, 0), double-free warnings, and pointers stored as uintptr_t to keep -Wuse-after-free lints quiet.
03. Thread-Safe Atomic Spinlock & Anti-Recursion Guards
In C++11 mode, table access is synchronized with lightweight atomic spinlocks (std::atomic_flag) and strict reentrancy guards, keeping concurrent allocation paths thread-safe without pulling in any dynamic-dependency overhead.
Diagnostic Engine Benchmarks
Case Study 04: LANwatch — Zero-unsafe Multi-Protocol Network Discovery
Parsing Untrusted Bytes Across 18 Protocols Without a Single unsafe Block
Network discovery tools spend their lives reading bytes they didn't write and can't trust — a DHCP lease, an mDNS query, an SSDP announcement, any of which can be malformed, truncated, or outright hostile. That job traditionally falls to hand-rolled C parsers walking raw pointers through a packet buffer, where one missed length check becomes a buffer over-read. LANwatch does the same job — decoding Ethernet frames down through ARP, DHCP, mDNS, SSDP, and a dozen other discovery protocols — using pnet_datalink and pnet_packet for frame-level access, plus hand-written parsers for everything above the wire, entirely in safe Rust.
01. Untrusted Bytes, Explicit Bounds, No unsafe
Every higher-level parser works directly on borrowed byte slices and checks its own boundaries before indexing into them. The DHCPv4 parser, for example, rejects any payload under 240 bytes and validates the RFC 2131 magic cookie (99.130.83.99) before trusting a single field — without that check, any UDP packet on port 67/68 gets decoded as DHCP and six arbitrary bytes become a device's MAC address. The result: zero unsafe blocks across roughly 12,000 lines of protocol-parsing Rust.
02. Compile-Time Protocol Opt-In via Cargo Features
mDNS/LLMNR/NBNS and SSDP/UPnP/WSD/LLDP/CDP support each sit behind their own Cargo feature (mdns, ssdp), gated with #[cfg(feature = "...")] rather than a runtime flag. A build that only needs DHCP leaves the rest out entirely — smaller binary, nothing to misconfigure at runtime, and the compiler simply omits code paths you didn't opt into.
03. One Enum, Every Protocol
Every decoded frame — DHCPv4/v6, mDNS, LLMNR, NBNS, SSDP, WSD, ARP, NDP, LLDP, CDP, and more — resolves into a single NetworkEvent enum. Rust's exhaustiveness checking means adding a new protocol variant forces every existing match on NetworkEvent to handle it explicitly, so a new discovery type can't silently fall through unhandled.
Parser Safety & Build Footprint
unsafe blocks across ~12,000 lines of protocol-parsing Rustmdns, ssdp, and http-api gate optional code at compile timeCase Study 05: AncileNet™ Mobile — The Router Engine, Inside an Android Phone
One Rust Core, From the Router to the Pocket
A router only filters a phone's traffic while the phone is on the home Wi-Fi. AncileNet™ Mobile is a parental-control app that takes the same Rust engine off the router and runs it on the phone itself, inside a full on-device tunnel. Every packet from every app passes through the engine on the phone — on Wi-Fi, on mobile data, at school or at a friend's house. It ships first on Android (10 and newer); the iOS shell (NEPacketTunnelProvider) follows. The app is Flutter, with a Kotlin VpnService shell and a thin Rust FFI crate (UniFFI) over the AncileNet core, built for arm64-v8a, 32-bit armeabi-v7a and x86_64.
01. A Whole-Phone Tunnel in User Space
Android hands the app a TUN file descriptor that carries all IPv4 and IPv6 traffic; Kotlin passes it to Rust, where ipstack turns raw packets back into streams and opens one real socket per flow. The app excludes itself from its own VPN so its sockets do not loop back in. Two traps came out of testing: ipstack blocks a runtime worker while a TCP stream drops, so the tunnel runs a 2-worker runtime and ends every flow before shutdown; and a LAN with local-only IPv6 broke apps, so the tunnel now carries IPv6 only after a route probe proves a real global IPv6 upstream.
02. Block at Once, and Close the Encrypted-DNS Side Door
The engine judges every packet. A blocked packet is answered at once — NXDOMAIN for DNS, a TCP reset, or ICMP — so apps fail fast instead of waiting for a timeout. DNS is answered inside the tunnel and forwarded to the current network's own resolvers, not a fixed public one, so the phone and an AncileNet router work together. DNS over TLS, HTTPS and QUIC are refused, so an app cannot route around the filter. The ad-and-tracker, VPN-service, harmful-site and encrypted-DNS block lists are the same signed releases the router uses, memory-mapped so they cost only the pages a lookup touches.
03. Hard to Switch Off: Standard and Protected Modes
A filter a child can turn off is not a filter. In Standard mode, device admin blocks uninstall, a parent PIN (PBKDF2, growing lockout) guards Stop, and a VPN "Disconnect" from Settings is recorded and undone after 2 s. Protected mode goes further: a newly reset phone scans a QR code during setup and makes AncileNet™ the device owner. Then VPN settings, Private DNS, uninstall, safe mode, new users and factory reset from Settings are locked, and Always-on VPN runs in lockdown, with no internet outside the tunnel. Only the parent's PIN removes the locks.
04. One App, Two Roles
The same app is the parent's console and the child's guard. The parent sets time limits, app locks and allow lists; a relay server carries the policy, and a push wakes the child's phone to sync at once — 0.8 s from the parent's save to the policy fetch on a locked Pixel 2. The parent hears when a new app is installed or a child's phone is reset, and a "Just me" mode protects one's own phone with no family, account or relay at all.
Measured on a Pixel 10


Engineering Memoirs: Building AncileNet™ from Zero to Line-Rate
Notes to My Younger Self: The Wins and the Reverts
At minimum frame size, a saturated gigabit wire gives you roughly 672 ns per packet — round it to a 1-microsecond budget — and when the machine enforcing that budget is an embedded Raspberry Pi CM4, the compiler feels like an adversary long before it becomes an ally. Building AncileNet™ (~56k lines of Rust, v0.10.0, 2,045 tests) taught me that real performance work is mostly ruthless subtraction — and that the biggest subtraction of all is not running the code: v0.10.0 does the same job on 26× less CPU because most packets never leave the kernel.
A note on the numbers below: the early per-packet timings come from Criterion benchmarks on an x86_64 dev machine and show the direction and size of each change, not the CM4's ceiling. Everything from v0.8.3 on was measured on the router itself — with an on-device profiler, or with a feature switched on and then off under the same load.
01. What I Would Do Again (The Winning Bets)
Zero-Copy Stack Lifetimes: slicing raw frames (&'a [u8]) straight off DMA ring buffers kept the hot path 100% allocation-free.
Dual-Plane Kernel Offload: O(1) CIDR drops installed at kernel prerouting priority -300, ahead of conntrack, paired with userspace NFQueue heuristics.
Privacy-First Cryptographic Profiling: pairing JA4/JA4S TLS client-server fingerprints removed any need for invasive MITM decryption.
NatJack Exposure Checks: automated /proc/sys kernel posture checks (/api/posture) plus real-time LAN address-conflict alerts (ip_mac_conflict), aimed at the modern NAT attack classes covered at Black Hat USA 2026 (CVE-2026-56179 / CVE-2026-56181 / CVE-2026-63913).
Counting in the Kernel, Not Copying Out of It: once a connection is decided, an eBPF socket filter counts its packets in a kernel map instead of delivering them — 99.3% of packets stay in the kernel and CPU falls from 20.7% to 0.8% of a core under the same load, with byte totals and JA4 fingerprints unchanged. 186 hand-assembled instructions, JIT-compiled to 1,168 bytes, loaded through raw bpf(2) because aya measured 284 KB larger.
A Profiler That Runs on the Target: OpenWrt ships without perf, so the engine carries its own setitimer-based sampler. Every major win since v0.8.3 was found in a flamegraph taken on the CM4 — the first one found 38% of the CPU in device discovery — and v0.9.0 cut per-packet CPU by a third across fourteen of them.
Running the Real Kernel Program in the Tests: a test-only eBPF interpreter executes the exact instructions the router runs against 20,000 generated and damaged frames. Its first run caught UDP payloads counted from the IP length instead of the UDP length — a bug the kernel would have run silently for ever.
02. What I Got Wrong, and What I Didn't Build
Benchmarks Blind to the Feature: a single runtime-policy rule — the product's headline parental-control feature — cost 42% of packet throughput, and ten rules cost 63%. None of the benchmark workloads initialized a policy store, so every run exercised the rules-disabled fast path and the regression went unnoticed. Fixing the benchmark first, then normalizing rule targets once at load and matching against borrowed slices, took the ten-rule case from 20 heap allocations per packet to zero — a +52.5% cumulative gain across six changes in that pass.
Blocking One Site Took the Whole Device Offline: blocking YouTube on one laptop cost that laptop all of its internet, and cost the router 64.67% of every packet it carried for every device. A Block banned the source of whichever packet matched — and on an outbound packet, that source is the device. Blocks are now keyed on the conversation, not an endpoint: only the blocked service stops.
Post-Quantum TLS Broke Fingerprinting Without a Single Error: an ML-KEM key share pushes a browser's ClientHello to ~1.9 KiB, past one TCP segment and past one QUIC packet. The parser saw a header promising more bytes than it was given and quietly returned nothing — no JA4, no server name. It hid because AncileNet is also the resolver, so DNS kept naming the flows. Handshakes are now reassembled by sequence number, and QUIC Initial packets decrypted per RFC 9001.
Three Deployments Spent on the Wrong Theory: when QUIC server names came back empty on the live network, I reasoned from the code — a size cap, then a capture gap — and shipped three fixes for problems that did not exist. One counter recording what was inside the packets named the real bug on its first reading. Now every failure counter names a cause, and the router is asked before the code is.
Optimizing the Cost I Assumed: profiling v0.10.0 showed its once-a-second harvest was the largest cost left, apparently from ~720 system calls a second. Batching them into a handful changed almost nothing (15.7% → 14.5%) — which was the useful result: the cost was the kernel walking all 16,384 hash buckets to list 111 entries, however it was asked. Reading only the keys the manager itself inserted, less often for idle flows, halved it.
When the Profiler Itself Lies: my own analyzer billed 7% of CPU to the dashboard with no browser open — a task's type name carried portal::frontend into every future polled inside it — and its Pareto curve stopped at 83%, because functions that were mostly idle were dropped along with their real work. A chart is a claim like any other; it gets checked against the raw stacks.
The Optimization That Wasn't: hand-packing FlowKey's derived Hash into a single write, instead of the usual five hasher writes, looked like a clear win. It measured 14.3% slower and got reverted. That negative result now sits in the test's doc comment, so the next person with the same idea finds the measurement instead of redoing the work.
The Feature I Didn't Build: once you're measuring drops, a ring that resizes itself under load looks like the obvious next step — and it would have been a vulnerability instead. pcap_set_buffer_size only accepts an inactive handle, so any resize means reopening capture and dropping packets during the gap; a control loop driven by load would hand an attacker a window of degraded inspection for nothing more than a traffic burst. So the ring is sized once, at startup, from system memory — which took a saturated link from ~33% buffer drops to zero — and left alone after that.
03. The Core Takeaway
Line rate inside a ~8.1 MB static binary on embedded hardware doesn't come from stacking abstractions — it comes from respecting the hardware, killing lock contention before it can start, and designing with mechanical sympathy in mind. The largest single win was not making code faster but not running it: leave a decided packet in the kernel and it costs almost nothing. And not one of the wins since v0.8.3 came from reasoning about the code — every one was found by measuring the router.
Production Footprint
// open source